Cause and Effect - Fishbone Diagram
Diagram the cause and effect relationships.
The Cause and Effect - Fishbone Diagram will help to visually display the many potential causes for a specific problem. It is particularly useful in identifying the root causes of your situation.
To create a Cause and Effect – Fishbone Diagram:
Step 1: Identify the problem.
Draw a line horizontally across the middle of a sheet of paper. Write your problem on the line.
Step 2: Determine the factors that cause the problem.
Next, identify the Factors that may contribute to the problem. Draw lines off the spine for each factor and label them. These may be people involved with the problem, systems, equipment, materials, external forces, etc. Try to draw out as many factors as possible.
Step 3: Identify related causes.
For each of the factors you considered in the step above, use Brainstorming to find possible causes of the problem that may be related to the factor. Show these as smaller lines coming off the 'bones' of the fish. Where a cause is large or complex, then it may be best to break it down into sub-causes. Show these as lines coming off each cause line.
Step 4 Analyze your diagram.
By this stage you should have a diagram showing all the possible causes of your problem. You can now investigate the most likely causes further.
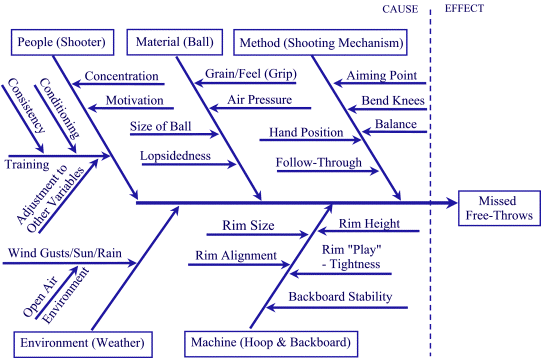
Here's an example of a Cause and Effect - Fishbone Diagram for missed free throws:

PRINTABLE: Word version of Cause and Effect - Fishbone Diagram.docx (Click link to download Word version).
PRINTABLE: PDF version of Cause and Effect - Fishbone Diagram.pdf (Click link to download PDF version).
