Flow Chart
Create a flow chart diagram of a process.
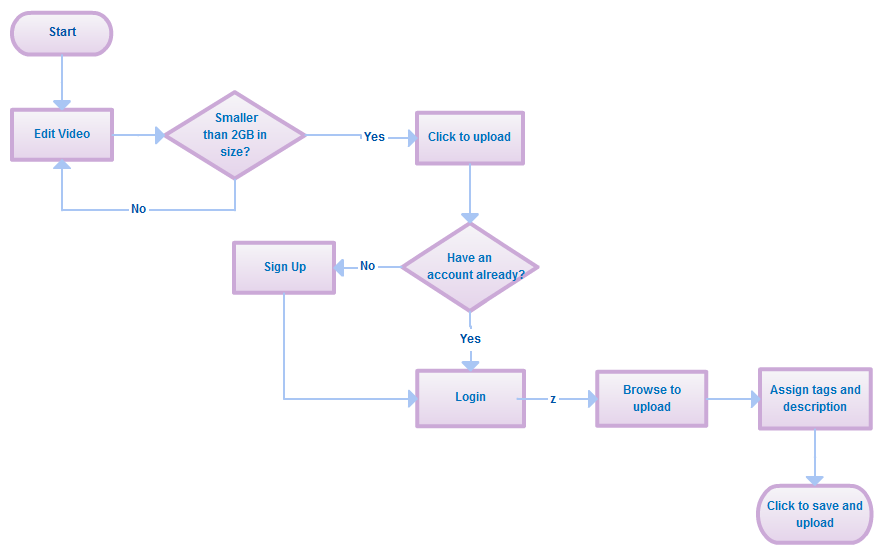
Flow Charts are diagrams that use symbols to represent the steps in a process. Arrows connect the symbols to show the process flow.
Flow charts can be used to:
- Define and document a process.
- Visually represent the steps of a process.
- Learn more about a process by mapping it out.
- Analyze a process.
- Communicate a process to others.
- Find areas for improvement in a process.
There are three main types of symbols used to create flow charts:
- Elongated Circles - represent the 'start' or 'finish' of a process.
- Rectangles - represent 'instructions' or 'actions'.
- Diamonds - represent 'decisions' that must be made.


Within each symbol, write down what that symbol represents. This could be the start or finish of a process, an action to be taken, or a decision to be made.
Symbols are connected to one another by connector arrows. These arrows show the direction of flow within a process.
To create a Flow Chart:
Step 1: Create a list of the process tasks in the order they occur.
Step 2: Start the flow chart by drawing the elongated circle shape and labeling it “Start”.
Step 3: Next, draw a rectangle or diamond. Write the instruction/action or decision inside the appropriate symbol. Then draw a connector arrow from the start symbol to the new symbol.
Step 4: Work through your whole process, adding symbols and arrows as you go. Remember to show the end of the process by using an elongated circle labeled “Finish”.
Step 5: Challenge your flow chart. Walk-through it step-by-step asking yourself if you have correctly represented the sequence of actions and decisions involved in the process.
Step 6: Analyze your flow chart. Think of ways you can improve different parts of the process.
There are many resources available on the internet. You can start by searching, "How do I make a flow chart?"
Diagram of a Flow Chart:

Word version of Flow Chart.docx (Click link to download Word version).
PDF version of Flow Chart.pdf (Click link to download PDF version).

Sources:
Mind Tools web site at www.mindtools.com
The Basics of Process Mapping, Richard Damelio, Florence, KY: Productivity Press, 2006.
