Objective Data - Structuring a System for Analysis
Saturday, November 30, 2013
There are many ways you can structure your objective data. But I know, there's only one way that you really care about. That's the one that will solve your problem.
The Cold Hard Truth
Let me share a nasty little secret with you. I'll call this bit of unsolicited advice, 'The Cold Hard Truth'. There are literally hundreds of analytical methods you can use to try to solve your problem. Odds are none of these methods, by themselves, will achieve your goal.
"How do I know which methods to use?"

Unfortunately, to know which methods to use on any given problem, you need to be an expert at using each method in many different situations. In-other-words, you need to be an expert at using all the methods to know which ones will work best. And you need to know all the methods to know what combination and sequence to use them. The cold hard truth is you need to have a PhD in Problem Solving to solve your problem using traditional methods. I know this because I had to become an expert at using each one of these methods, just to know which ones would work best for me. This learning process took years.
But there's even more to this painful story. Even after I became an expert at using all these classic problem solving tools, I found using the outputs they produced were an organizational nightmare. I was pissed. I had spent all this time and effort learning these methods, only to find out I had created an unmanageable clutter of paperwork. I tried many different ways of organizing my work over the years. Then it donned on me.

After completing each one of my problem solving projects, I had huge binders jam packed with paperwork. I seemed to me that the crux of my organizational problem was that I was using tools created in the era of pencil-and-paper and I'm now living in the digital information age.
It was time for me to move my analytical processes out of the horse and buggy days into the computer age. So, I dusted off my relational database software program and got to work.
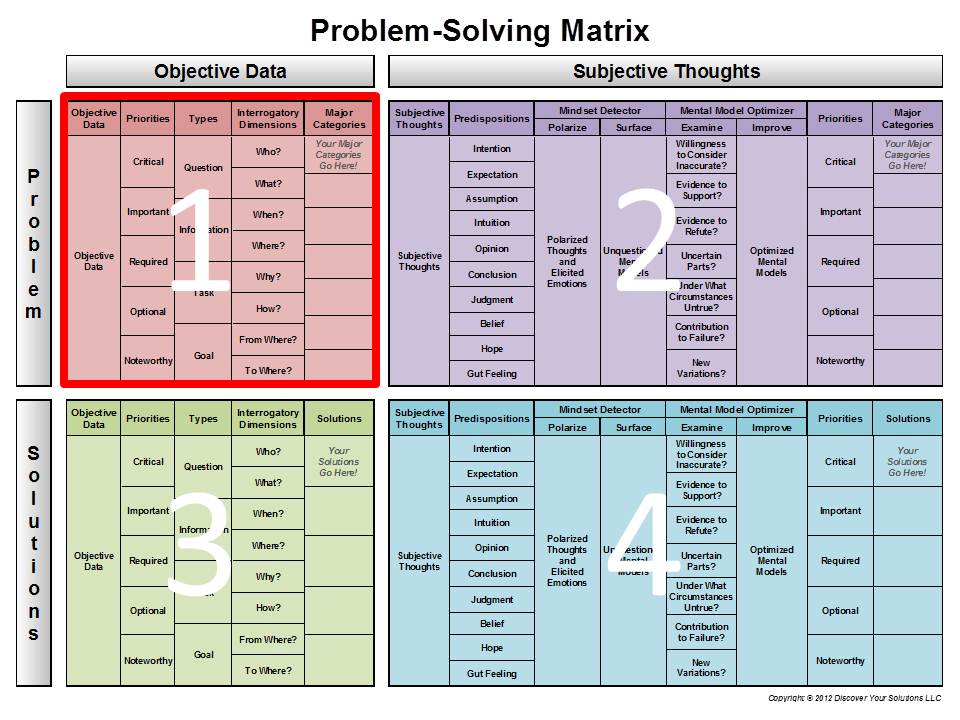
Theoretically, I needed a software program I could superimpose on top of all my other tools, techniques, & methods that would organize their data outputs. After a few years of research and development, I decided on a conceptual design that would break my analysis into a two-by-two matrix (see diagram below). First, I separated the information about my Problem and Solutions. Next, I divided my analysis into Objective Data and Subjective Thoughts. I called my invention the Problem Solving Matrix. I've discussed some of the structural elements of the Problem Solving Matrix in my two previous blog posts.
Helpful Hint:
If you're looking at this graphic for the first time, I don't expect you to completely understand it at first glance. I know it looks complex but each part is pretty simple. The reason I've presented it here is so you can see an overview of my methodology.

DOWNLOAD: Word version of Problem-Solving Matrix.docx (Click link to download Word version).
DOWNLOAD: Excel version of Problem-Solving Matrix.xlsx (Click link to download Excel version).
DOWNLOAD: PDF version of Problem-Solving Matrix.pdf (Click link to download PDF version).
In this blog post, I'm going to discuss the analytical system I've devised for structuring Objective Data (boxes #1 and #3 above). It has four structuring fields: Major Categories, Interrogatory Dimensions, Type of Data, and Priority.
Major Categories
The first structural element you'll use to describe your Objective Data is what I've called Major Categories. The idea is pretty simple. You just break your problem down into its major component parts. Your goal here is to identify all of your Major Categories.

Major Categories should be:
- Clearly defined,
- Mutually exclusive, and
- Collectively exhaustive.
Your Major Categories are the foundation that the rest of your problem-solving structure will be built upon. For complex problems, you may have multiple levels of sub-categories that form a hierarchical structure of your problem.
For help to decompose your problem into its major factors, use our Major Categories tool in our Toolkit section.
Defining your Major Categories may seem like an easy task but you need to take your time here and think this all the way through. Keep in mind that you must have a place to put all of your data (i.e. no pieces of data can be left out). Please also remember that your Major Categories will determine the scope of your analysis.

Interrogatory Dimensions
'Interrogatory Dimensions' is a fancy way of saying, describe your data by its root question.
Asking the right questions has always been a good way to solve problems. Since the beginning of human development, our curiosity and ability to find answers to questions has been a hallmark of the species. With the advent of language we developed words to describe different types of questions to each other and to ourselves.
Many of you may already be familiar with the age-old journalist's list of: Who, What, When, Where, Why, and How. These are called interrogatory words.
Unfortunately, I found that I could not describe all of my objective data with just these six interrogatory words. The data I had trouble defining all shared a common trait. They were related to the time continuum. It turned out that the interrogatory word when was fine for describing data related to the present but it wasn't good at defining some data related to my problem's past or my problem's future.
So, I went back in time and researched the root words related to questioning. I found two no longer used archaic words 'whence' and 'whither' that were just what I was looking for. Next, I needed to find their modern usages. It turned out that the modern usage for whence is From Where and for whither is To Where.
From Where describes the type of questioning needed to analyze the origins of your problem, its sources, and its root causes.
To Where describes the type of questioning needed to analyze your direction, outcomes, and goals.
Interrogatory Dimensions are important to your analysis because they make sure all of your Major Categories have been completely questioned. In essence, it becomes a de facto checklist for completeness. Interrogatory Dimensions also provides another structural element that you can use to mirror between your problem and your solutions.
Types of Data
I divided Objective Data into four data types: key questions, information, tasks, and goals.

Key Questions - Asking questions is one of the most important techniques you can use to explore the different dimensions of your problem. It just makes sense that finding the right questions will give you a better understanding of your problem and get you closer to the answers that will eventually solve your problem. As you go through the problem-solving process keep track of your key questions. To help you get started, I've developed several lists of generic questions: Who, What, When, Where, Why, How, From Where, To Where, and the Phoenix Checklist. Review the lists of generic questions and pick out the ones that you consider to be key questions for your situation. Of course, the questions you think of on your own could be the best questions of all.
Information - This is where most of your data will go. It collects the answers to your questions and it's a catch all for items that don't fit into any of the other data types.
Tasks - Collecting and organizing your tasks can be a big job. I gather all of my tasks together under this data type. If I have a large amount of tasks for many other people I usually use a separate Task Manager program. There are many of them available on the internet.
Goals - Identifying your goals is an important part of problem solving. I created a separate data type just for goals. If you need help with your goals, check out my Goals tool in the Toolkit.
Priority
To help you prioritize your Objective Data I created a Priority field that you can use to sort your data.
It's a simple system:
1. Critical
2. Important
3. Required
4. Optional
5. Noteworthy
Structuring Your Objective Data Can Save Your Sanity
The analytical system I've created for structuring your Objective Data will help you optimize your ability to manage your data. It will make your data more functional (ex. sorting and filtering). It will also give you the unique capability of mapping your data between your problem and your solutions.
Having a logical, well thought out system to manage your problem solving data may be the difference between solving your problem and going crazy. That's what structuring does. It establishes order; order instead of chaos.
by Keith Glein, Founder & CEO
